

(image: bfishadow/flickr)
![]()
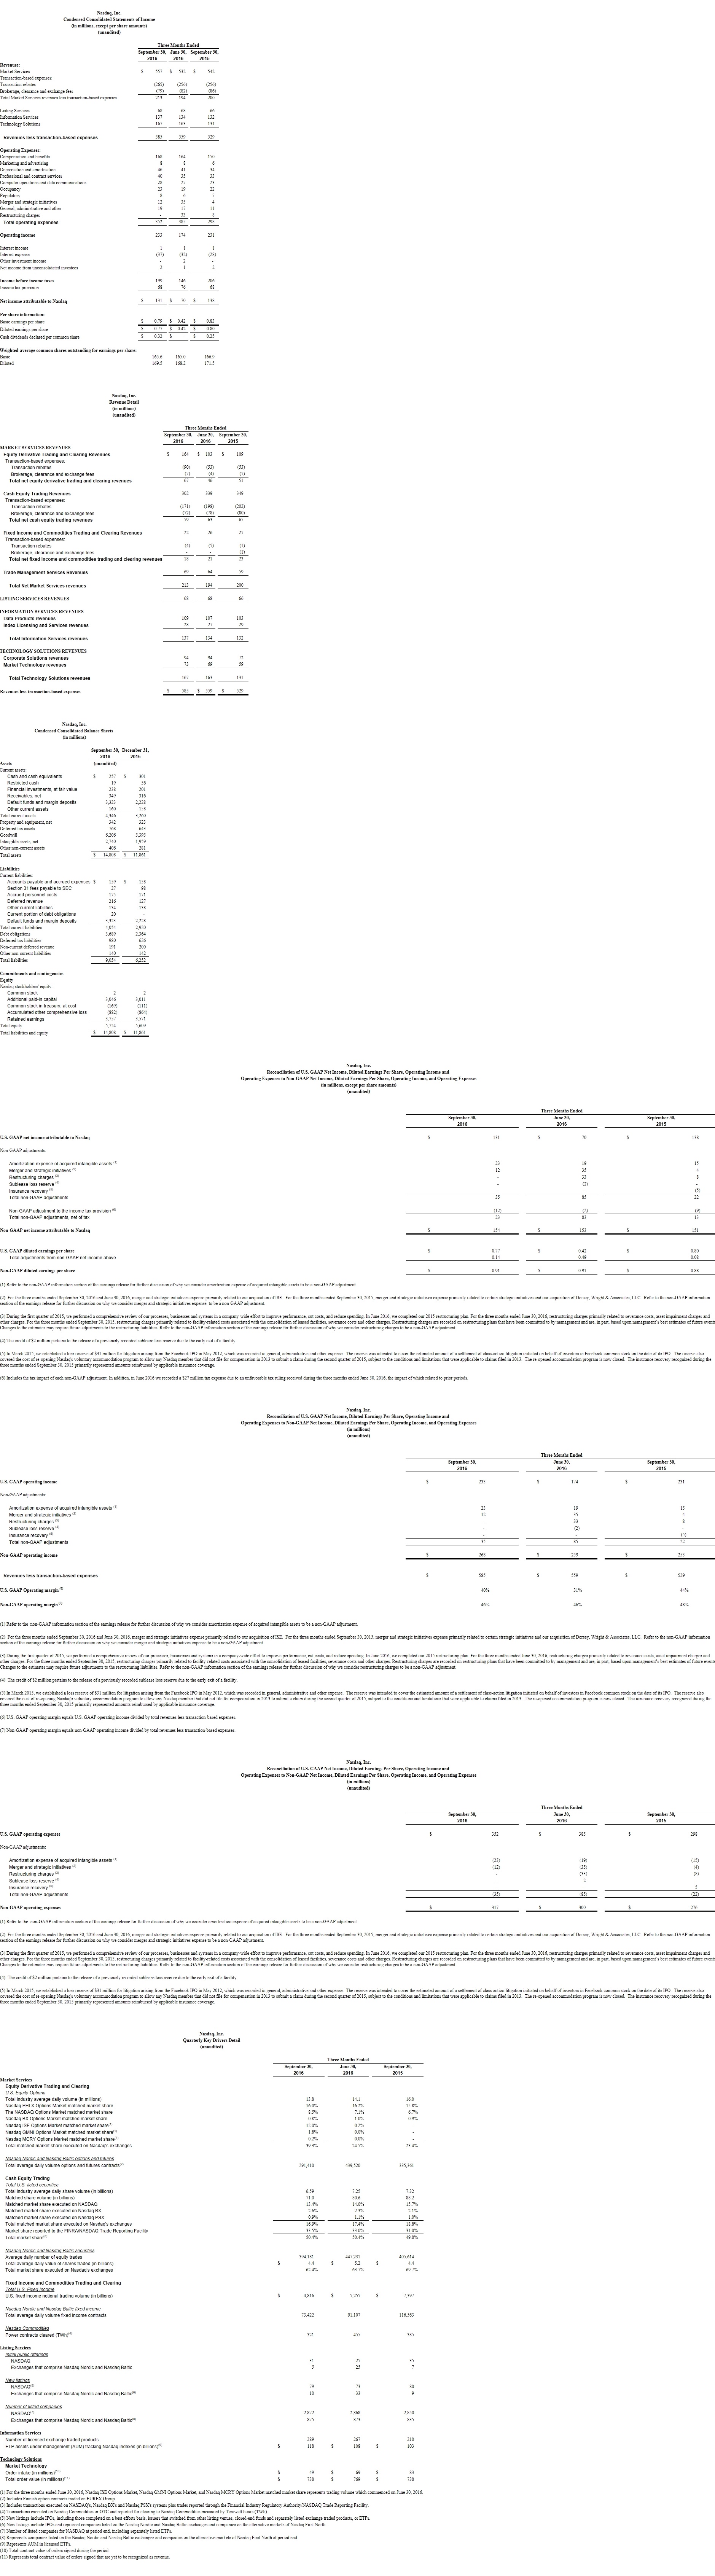
NEW YORK, Oct. 26 (Korea Bizwire) — Nasdaq, Inc. (Nasdaq:NDAQ) today reported strong financial results for the third quarter of 2016. Third quarter net revenues were $585 million, up $56 million or 11% from $529 million in the prior year period, driven primarily by a $58 million positive impact from acquisitions. Organic revenue growth in the non-trading segments4 in the third quarter of 2016 was offset by a contraction in trading revenues when compared to an especially volatile trading environment in the prior-year period.
“The third quarter’s strong financial results showcase how the complementary nature of Nasdaq’s business mix can deliver against a variety of macro backdrops. While our marketplaces were subject to lower volatility and industry volumes compared to the prior year period, the company’s non-trading segments expanded to new record levels,” said Bob Greifeld, CEO, Nasdaq.
Mr. Greifeld continued, “The Information Services, Technology Solutions, and Listing Services segments were especially strong in the third quarter, but more importantly they each represent areas where we have found attractive opportunities to invest and where our technology leadership can be leveraged effectively to benefit our clients and create new opportunities for growth.”
Operating expenses were $352 million in the third quarter of 2016, up $54 million from $298 million in the third quarter of 2015. The increase primarily reflects incremental expenses from the acquisitions of Nasdaq CXC, formerly Chi-X Canada (February 2016), Marketwired (February 2016), Boardvantage (May 2016), and ISE (June 2016).
Non-GAAP operating expenses were $317 million in the third quarter of 2016, up $41 million from $276 million in the third quarter of 2015. This increase primarily reflects $29 million in incremental operating expenses from the acquisitions closed in 2016 as well as $13 million due to organic growth.
“During the third quarter, the company made significant progress integrating our recent acquisitions, moving the synergy achievement up to $23 million on a run rate basis, which contributed to meaningful accretion to our non-GAAP results,” said Michael Ptasznik, Chief Financial Officer and Executive Vice President, Nasdaq.
Mr. Ptasznik continued, “We also saw an attractive opportunity to return $55 million to shareholders through the share buyback program in the third quarter. I’m pleased to say that in addition to executing on several acquisition opportunities this year, the company has returned 54% of our non-GAAP net income year-to-date to shareholders through dividends and buybacks.”
Net income attributable to Nasdaq for the third quarter of 2016 was $131 million, or $0.77 per diluted share, compared with $138 million, or $0.80 per diluted share, in the prior year quarter. On a non-GAAP basis, net income attributable to Nasdaq for the third quarter of 2016 was $154 million, or $0.91 per diluted share, compared with $151 million, or $0.88 per diluted share, in the third quarter of 2015.
The company repurchased 800,938 shares for $55 million in the third quarter of 2016 at an average price of $68.19. As of September 30, 2016, there was $429 million remaining under the board authorized share repurchase program.
At September 30, 2016, the company had cash and cash equivalents of $257 million and total debt of $3,709 million, resulting in net debt of $3,452 million. This compares to net debt of $2,063 million at December 31, 2015.
1 Represents revenues from our Information Services, Technology Solutions, and Listing Services segments, as well as our Trade Management Services business, formerly referred to as Access and Broker Services.
2 Represents revenues less transaction-based expenses.
3 Refer to our reconciliations of U.S. GAAP to non-GAAP net income, diluted earnings per share, operating income and operating expenses included in the attached schedules.
4 Represents revenues from our Information Services, Technology Solutions, and Listing Services segments.
BUSINESS HIGHLIGHTS
Market Services (36% of total net revenues) - Net revenues were $213 million in the third quarter of 2016, up $13 million when compared to the third quarter of 2015. The increase primarily reflects an increase in revenues from the ISE and Nasdaq CXC acquisitions, partially offset by declines in trading volumes as compared to multi-year high industry trading volumes experienced in the third quarter of 2015.
Equity Derivatives (11% of total net revenues) – Net equity derivative trading and clearing revenues were $67 million in the third quarter of 2016, up $16 million compared to the third quarter of 2015. The increase is primarily due to the inclusion of revenues from our acquisition of ISE in June 2016 and higher market share at The NASDAQ Options Market and Nasdaq PHLX, partially offset by lower industry trading volumes.
Cash Equities (10% of total net revenues) – Net cash equity trading revenues were $59 million in the third quarter of 2016, down $8 million compared to the third quarter of 2015. This decrease reflects lower matched market share, lower industry trading volumes and lower U.S. average net capture, partially offset by the inclusion of net revenues associated with the acquisition of Nasdaq CXC.
Fixed Income and Commodities Trading and Clearing1 (3% of total net revenues) – Net fixed income and commodities trading and clearing (FICC) revenues were $18 million in the third quarter of 2016, down $5 million from the third quarter of 2015, due to declines in commodities and U.S. fixed income revenues and the impact of trading incentives on Nasdaq Futures (NFX) revenues.
Trade Management Services (12% of total net revenues) – Trade management services revenues were $69 million in the third quarter of 2016, up $10 million compared to the third quarter of 2015, due to the inclusion of revenue from the acquisition of ISE and an increase in customer demand for network connectivity.
1 Our FICC business was formerly referred to as fixed income, currency and commodities trading and clearing.
Information Services (23% of total net revenues) – Revenues were $137 million in the third quarter of 2016, up $5 million from the third quarter of 2015.
Data Products (18% of total net revenues) – Data products revenues were $109 million in the third quarter of 2016, up $6 million compared to the third quarter of 2015 primarily due to growth in proprietary data products revenues, the inclusion of revenues from the acquisitions of ISE and Nasdaq CXC, as well as higher audit collections.
Index Licensing and Services (5% of total net revenues) – Index licensing and services revenues were $28 million in the third quarter of 2016, down $1 million from the third quarter of 2015. The revenue decline was primarily due to a decrease in the value of underlying assets associated with non-ETP Nasdaq-licensed products and lower fees associated with derivative products licensing Nasdaq indices, due to lower volumes.
Technology Solutions (29% of total net revenues) – Revenues were $167 million in the third quarter of 2016, up $36 million from the third quarter of 2015. The increase primarily reflects the inclusion of revenues from the acquisitions of Marketwired and Boardvantage, as well as $13 million in organic revenue growth in our Market Technology business.
Corporate Solutions (16% of total net revenues) – Corporate solutions revenues were $94 million in the third quarter of 2016, up $22 million from the third quarter of 2015. The increase was due to the inclusion of revenues from the Marketwired and Boardvantage acquisitions.
Market Technology (13% of total net revenues) – Market technology revenues were $73 million in the third quarter of 2016, up $14 million from the third quarter of 2015. The increase was driven primarily by growth in revenues from software licensing and support as well as surveillance products.
Listing Services (12% of total net revenues) – Revenues were $68 million in the third quarter of 2016, up $2 million compared to the third quarter of 2015 primarily due to higher revenues in the Nordics due to new company listings.
CORPORATE HIGHLIGHTS
- NFX growth continues Nasdaq’s commodities expansion. NFX, a U.S.-based derivatives market for key energy benchmarks, has seen increasing traction since launch in July 2015. During the month of September 2016, open interest in NFX products reached a record 1.2 million contracts, and during the third quarter of 2016, trading volume of 8.9 million contracts increased 16% from 7.7 million contracts in the second quarter of 2016. Since its July 2015 inception, 118 firms have traded on NFX.
- The Nasdaq Stock Market leads U.S. exchanges for IPOs and switches. In the U.S. market, The Nasdaq Stock Market welcomed 79 new listings in the third quarter of 2016, including 31 IPOs such as Trade Desk, Apptio and Nutanix. During the third quarter of 2016, 74% of all U.S. IPOs were listed on Nasdaq. In addition, The Nasdaq Stock Market welcomed 16 switches thus far in 2016 with an aggregate market capitalization of $42 billion, including IHS Markit. Nasdaq announced 24 new exchange-traded products (ETP) listings and one switch in the third quarter, bringing Nasdaq’s total ETP listings to 295, up 48% from the third quarter of 2015.
- Corporate Solutions launches Nasdaq Influencers while Nasdaq IR Insight sees continued strong adoption. Nasdaq has seen strong adoption of the next generation IR platform with 86% of companies upgraded since January. Additionally, Nasdaq’s Corporate Solutions business launched Nasdaq Influencers, a new solution for communications and marketing professionals to discover and connect with the most relevant thought leaders in their industry and uncover new opportunities to share their news and information, insights and recommendations as well as drive brand identity and awareness.
- Nasdaq sees strong growth in number of ETPs and assets tracking Nasdaq indexes. The number of ETPs licensed to Nasdaq indexes increased to 289 at September 30, 2016 versus 267 at June 30, 2016, including several non-U.S. product launches in China, Taiwan, and Australia. Two new Nasdaq-100 ETPs were listed in Hong Kong with BMO and BlackRock and one in Taiwan with Fubon Asset Management. Additionally, BetaShares launched a series of Global Ex-Australia hedged ETPs based on Nasdaq indexes. Overall AUM in exchange traded products (ETPs) benchmarked to all Nasdaq indexes increased 15% to $118 billion as of September 30, 2016 compared to September 30, 2015.
ABOUT NASDAQ
Nasdaq (Nasdaq:NDAQ) is a leading provider of trading, clearing, exchange technology, listing, information and public company services across six continents. Through its diverse portfolio of solutions, Nasdaq enables customers to plan, optimize and execute their business vision with confidence, using proven technologies that provide transparency and insight for navigating today’s global capital markets. As the creator of the world’s first electronic stock market, its technology powers more than 70 marketplaces in 50 countries, and 1 in 10 of the world’s securities transactions. Nasdaq is home to more than 3,700 listed companies with a market value of $10.0 trillion and approximately 18,000 corporate clients. To learn more, visit: nasdaq.com/ambition or business.nasdaq.com.
NON-GAAP INFORMATION
In addition to disclosing results determined in accordance with U.S. GAAP, Nasdaq also discloses certain non-GAAP results of operations, including, but not limited to, net income attributable to Nasdaq, diluted earnings per share, operating income, and operating expenses, that include certain adjustments or exclude certain charges and gains that are described in the reconciliation table of U.S. GAAP to non-GAAP information provided at the end of this release. Management uses this non-GAAP information internally, along with U.S. GAAP information, in evaluating our performance and in making financial and operational decisions. We believe our presentation of these measures provides investors with greater transparency and supplemental data relating to our financial condition and results of operations. In addition, we believe the presentation of these measures is useful to investors for period-to-period comparisons of results as the items described below do not reflect ongoing operating performance.
These measures are not in accordance with, or an alternative to, U.S. GAAP, and may be different from non-GAAP measures used by other companies. Investors should not rely on any single financial measure when evaluating our business. We recommend investors review the U.S. GAAP financial measures included in this earnings release. When viewed in conjunction with our U.S. GAAP results and the accompanying reconciliations, we believe these non-GAAP measures provide greater transparency and a more complete understanding of factors affecting our business than U.S. GAAP measures alone.
We understand that analysts and investors regularly rely on non-GAAP financial measures, such as non-GAAP net income attributable to Nasdaq, non-GAAP diluted earnings per share, non-GAAP operating income and non-GAAP operating expenses to assess operating performance. We use these measures because they highlight trends more clearly in our business that may not otherwise be apparent when relying solely on U.S. GAAP financial measures, since these measures eliminate from our results specific financial items, such as those described below, that have less bearing on our ongoing operating performance.
Amortization expense of acquired intangible assets: We amortize intangible assets acquired in connection with various acquisitions. Intangible asset amortization expense can vary from period to period due to episodic acquisitions completed, rather than from our ongoing business operations. As such, if intangible asset amortization is included in performance measures, it is more difficult to assess the day-to-day operating performance of the businesses, the relative operating performance of the businesses between periods and the earnings power of Nasdaq. Management does not consider intangible asset amortization expense for the purpose of evaluating the performance of our business or its managers or when making decisions to allocate resources. Therefore, we believe performance measures excluding intangible asset amortization expense provide investors with a more useful representation of our businesses’ ongoing activity in each period.
Restructuring charges: Restructuring charges are associated with our 2015 restructuring plan to improve performance, cut costs and reduce spending and are primarily related to (i) the rebranding of our company name from The NASDAQ OMX Group, Inc. to Nasdaq, Inc., (ii) severance and other termination benefits, (iii) costs to vacate duplicate facilities, and (iv) asset impairment charges. We exclude these restructuring costs because these costs do not reflect future operating expenses and do not contribute to a meaningful evaluation of Nasdaq’s ongoing operating performance or a comparison of Nasdaq’s performance between periods.
Merger and strategic initiatives expense: We have pursued various strategic initiatives and completed a number of acquisitions in recent years which have resulted in expenses which would not have otherwise been incurred. These expenses include integration costs, as well as legal, due diligence and other third party transaction costs. The frequency and the amount of such expenses vary significantly based on the size, timing and complexity of the transaction. Accordingly, we exclude these costs for purposes of calculating non-GAAP measures which provide a more meaningful analysis of Nasdaq’s ongoing operating performance or comparisons of Nasdaq’s performance between periods.
Other significant items: We have excluded certain other charges or gains that are the result of other non-comparable events to measure operating performance. For the three months ended June 30, 2016, other significant items include tax expense due to an unfavorable tax ruling received during the three months ended June 30, 2016, the impact of which related to prior periods, and the release of a sublease loss reserve due to the early exit of a facility. For the three months ended September 30, 2015, other significant items include an insurance recovery for litigation arising from the Facebook IPO in May 2012. We believe the exclusion of such amounts, which arise outside of the normal course of business, allow management and investors to better understand the financial results of Nasdaq.
Foreign exchange impact on revenue: In countries with currencies other than the U.S. dollar, revenues and expenses are translated using monthly average exchange rates. Certain discussions in this release isolate the impact of year-over-year foreign currency fluctuations to better measure the comparability of operating results between periods. Operating results excluding the impact of foreign currency fluctuations are calculated by translating the current period’s results by the prior period’s exchange rates.
CAUTIONARY NOTE REGARDING FORWARD-LOOKING STATEMENTS
Information set forth in this communication contains forward-looking statements that involve a number of risks and uncertainties. Nasdaq cautions readers that any forward-looking information is not a guarantee of future performance and that actual results could differ materially from those contained in the forward-looking information. Such forward-looking statements include, but are not limited to (i) projections relating to our future financial results, growth, trading volumes, products and services, order backlog, taxes and achievement of synergy targets, (ii) statements about the closing or implementation dates and benefits of certain acquisitions and other strategic, restructuring, technology, de-leveraging and capital return initiatives, (iii) statements about our integrations of our recent acquisitions, (iv) statements relating to any litigation or regulatory or government investigation or action to which we are or could become a party, and (v) other statements that are not historical facts. Forward-looking statements involve a number of risks, uncertainties or other factors beyond Nasdaq’s control. These factors include, but are not limited to, Nasdaq’s ability to implement its strategic initiatives, economic, political and market conditions and fluctuations, government and industry regulation, interest rate risk, U.S. and global competition, and other factors detailed in Nasdaq’s filings with the U.S. Securities and Exchange Commission, including its annual reports on Form 10-K and quarterly reports on Form 10-Q which are available on Nasdaq’s investor relations website at http://ir.nasdaq.com and the SEC’s website at www.sec.gov. Nasdaq undertakes no obligation to publicly update any forward-looking statement, whether as a result of new information, future events or otherwise.
WEBSITE DISCLOSURE
Nasdaq intends to use its website, ir.nasdaq.com, as a means for disclosing material non-public information and for complying with SEC Regulation FD and other disclosure obligations. These disclosures will be included on Nasdaq’s website under “Investor Relations.”
NDAQF
MEDIA RELATIONS CONTACT:
Allan Schoenberg
+1.212.231.5534
allan.schoenberg@nasdaq.com
INVESTOR RELATIONS CONTACT:
Ed Ditmire, CFA
+1.212.401.8737
ed.ditmire@nasdaq.com
Source: NASDAQ, Inc. via GLOBE NEWSWIRE


