
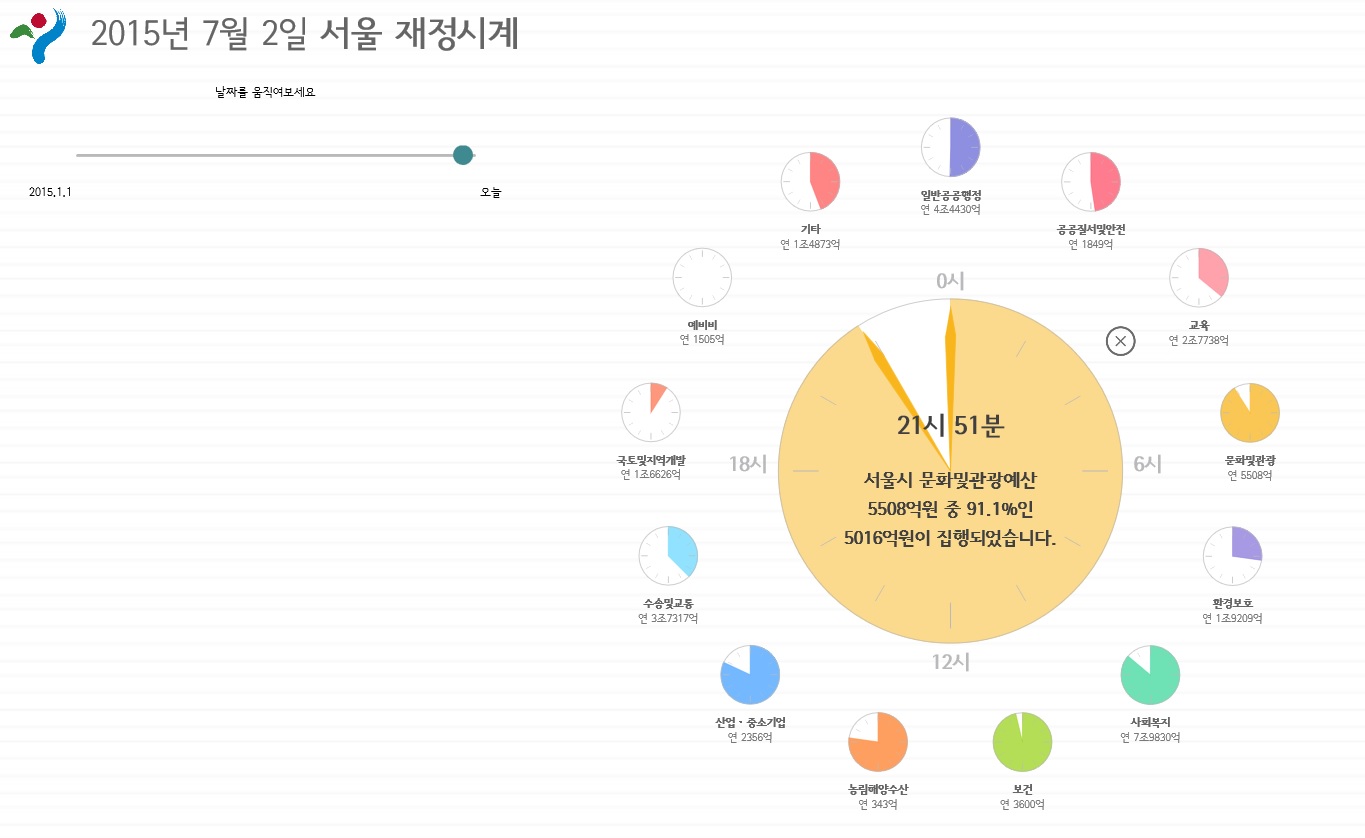
“Finance Watch” shows budget expenditures on a daily basis and by sector. (image: Seoul Metropolitan Government)
SEOUL, July 3 (Korea Bizwire) – Seoul Metropolitan Government is making public core data such as budget expenditures, consumer prices and levels of fine dust through interactive infographics.
The Seoul city government announced on July 2 the introduction of “Interactive Seoul!”, a service that provides access to important public data. For example, its “Finance Watch” shows budget expenditures on a daily basis and by sector.
On “Seoul’s Consumer Price at a glance” page, users can compare the prices of 16 major agricultural and fishery products at traditional markets and supermarkets. Later, it will provide up-to-date information about tax revenue and city spending on a daily basis.
Currently, the interactive infographics are available on the city’s statistics homepage (stat.seoul.go.kr), with plans to later expand to kiosks in Citizens Hall at Seoul City Hall and touch screens in subway stations.
Seoul mayor Park Won-soon said, “The service is not just about offering numeric data to the people, but helping people understand the data with visualized designs. We will further provide the public data in an easy to understand way.”
By M. H. Lee (mhlee@koreabizwire.com)


