
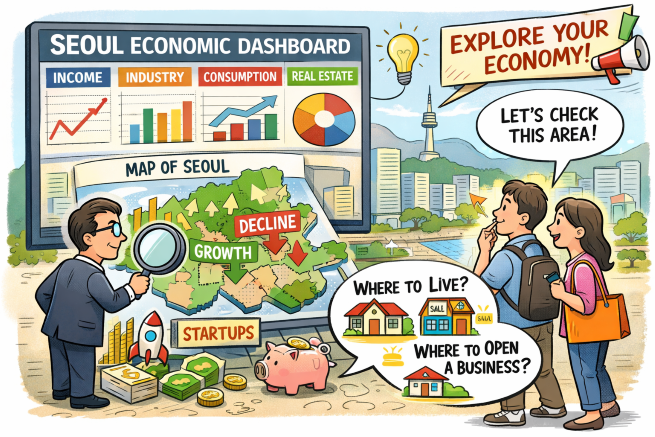
A New Digital Dashboard Lets Seoul Residents See How the City’s Economy Is Shifting (Image supported by ChatGPT)
SEOUL, Jan. 13 (Korea Bizwire) — Seoul will roll out a new data-driven platform this week that allows residents, entrepreneurs and policymakers to track the city’s economic pulse in unprecedented detail, city officials said on Monday.
The Seoul Metropolitan Government announced that it will launch an online “Economic Dashboard” on the Seoul Data Hub starting Jan. 13, consolidating economic data that had previously been scattered across multiple institutions.
The platform offers a visual overview of business activity, income levels, consumption patterns and industrial change across the capital.
The dashboard covers nine broad categories — including economic structure and growth, business cycles, industry, startups and self-employment, jobs and income, prices, consumption, household finance and real estate — presented through 40 interactive screens.
Users can explore how different sectors have expanded or declined over time, and how economic conditions vary by neighborhood.

Myeongdong Street in central Seoul is crowded with locals and foreign visitors. (Yonhap)
One of the platform’s core features is a three-dimensional visualization of industrial and commercial changes at the administrative-district level, based on business census data from 2010 to 2023. The tool allows users to see, year by year, which industries have grown or faded in specific districts across Seoul.
The service also maps the distribution of around 100 consumer-facing industries — such as restaurants, retail and personal services — showing where they are concentrated and how those patterns have evolved.
Economic indicators such as startup rates, average income, consumer spending and household debt can be viewed together, enabling side-by-side comparisons within the same area.
City officials said the platform is designed to support everyday economic decisions, from choosing where to live or open a business to planning consumption, while also giving self-employed workers and prospective entrepreneurs clearer insight into local market conditions.
“The goal is to provide citizens with a reliable compass for navigating the local economy and to support evidence-based policymaking,” said Kang Ok-hyun, head of Seoul’s Digital City Bureau, adding that the city plans to further refine and expand the service over time.
Ashley Song (ashley@koreabizwire.com)


